
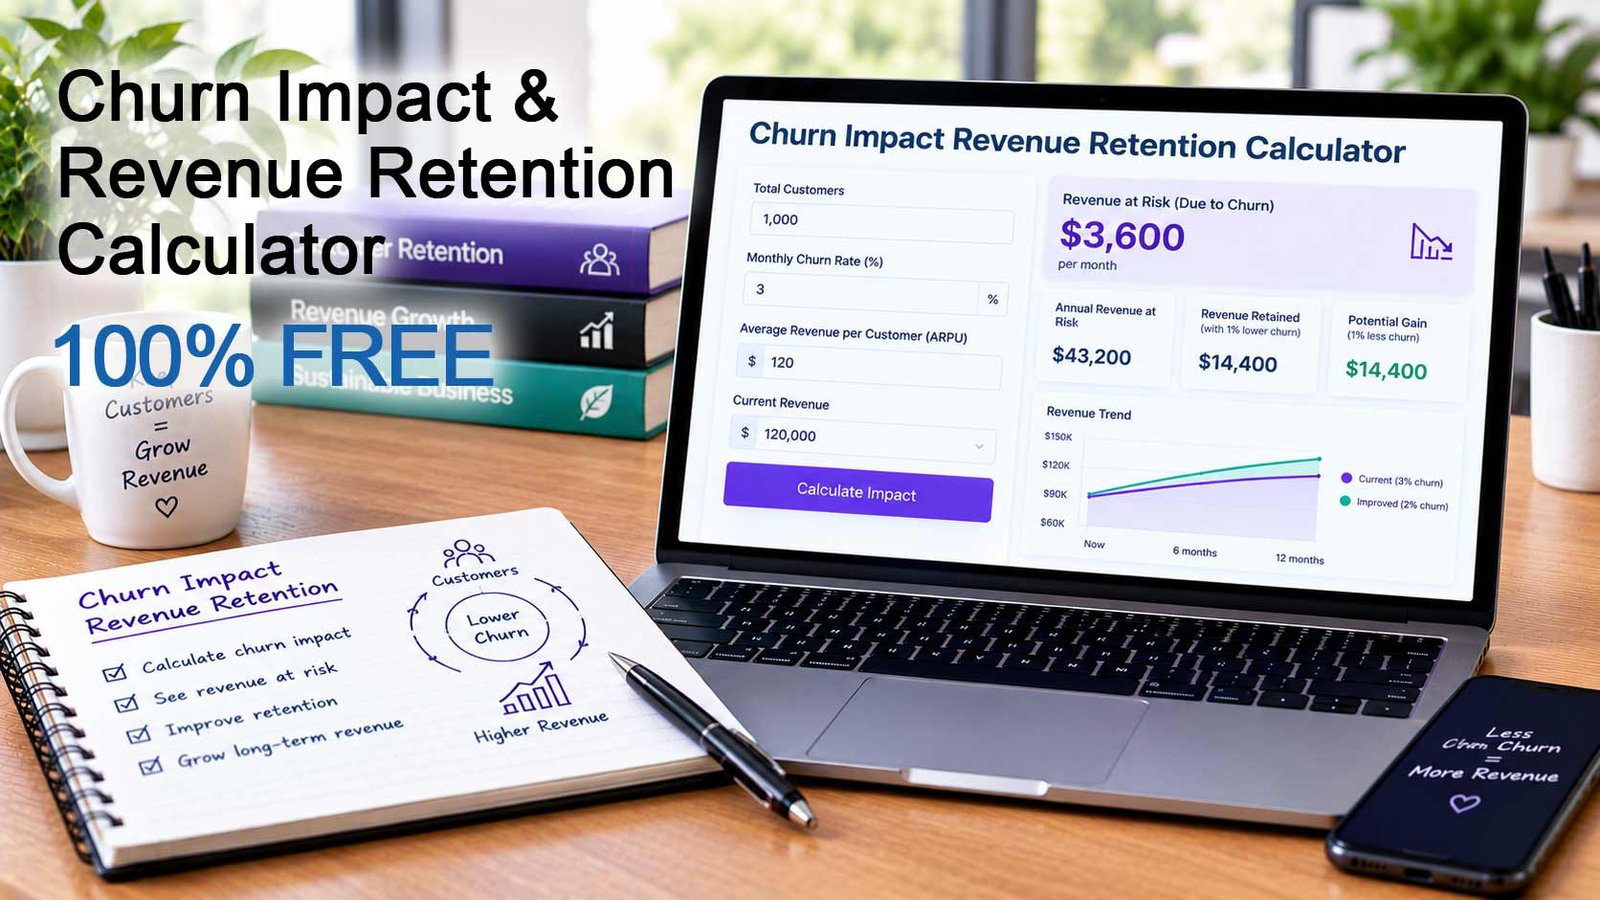
Customer churn is one of the most important numbers in any subscription business. A change of one or two percentage points in monthly churn can look minor on a dashboard, but over a year or more it can add up to hundreds of thousands of dollars in Annual Recurring Revenue (ARR). Our free Churn Impact & Revenue Retention Calculator helps you see that effect clearly.
Enter your customer base, pricing, new customer growth and two churn rates, your current rate and a target rate. The calculator then projects your ARR over 12 to 36 months under both scenarios and shows the difference.
What Does the Churn Impact & Revenue Retention Calculator Do?
The calculator compares two futures for your SaaS business: one where churn stays where it is today, and one where you reduce it to a target level. It estimates:
- Projected ARR at your current churn rate
- Projected ARR at your target churn rate
- The ARR impact of the churn change
- The cumulative revenue impact over the projection period
It also includes a calculation breakdown with equivalent annual churn, customers remaining at the end of the period, the share of your starting customers still active, average customer lifetime and cumulative revenue for both scenarios.
Who Is This Calculator For?
This tool is built for SaaS and subscription businesses, including:
- SaaS founders and CEOs who want to understand how retention affects company growth
- Customer success and retention managers who need to justify investment in onboarding, support or loyalty programs
- Product managers prioritizing features that reduce cancellations
- Marketing and growth teams balancing acquisition spend against retention
- Finance teams and investors building revenue forecasts
- Agencies and consultants advising subscription businesses
How to Use the Calculator
- Set your current number of paying customers.
- Enter the average monthly revenue you earn per customer.
- Set how many new customers you expect to add each month.
- Choose a projection period between 12 and 36 months.
- Set your current monthly churn rate.
- Set the target monthly churn rate you want to compare against.
- Review the results and the calculation breakdown. Every value updates instantly as you adjust the inputs.
Try small changes first, such as reducing churn from 5% to 4.5%. The results show why even modest retention improvements are often worth more than a comparable increase in new customer acquisition.
What Each Input Field Means
Current paying customers. The number of customers who are paying you today. This is your starting point for the projection.
Average monthly revenue per customer. Often called ARPA (average revenue per account) or ARPU. Divide your monthly recurring revenue by your number of paying customers to get this figure.
New customers per month. The number of new paying customers you expect to add each month. The calculator treats this as a constant number.
Projection period. How far ahead the calculator looks, from 12 to 36 months.
Current monthly churn rate. The percentage of customers who cancel each month under your current performance. For example, if you start a month with 1,000 customers and 50 cancel, your monthly churn rate is 5%.
Target monthly churn rate. The churn rate you want to test, such as the result of an onboarding improvement, better support or a new retention program. The gap between the two rates is what the calculator turns into a revenue figure.
How the Calculations Work
The calculator simulates your business one month at a time. All formulas below are written in plain text so you can follow or reproduce them.
Monthly customer count
Customers at end of month = Customers at start of month x (1 – Monthly churn rate) + New customers per month
This is repeated for every month in the projection period, once with your current churn rate and once with your target churn rate. Churn rates are used as decimals, so 5% becomes 0.05.
Monthly revenue
Monthly revenue = Customers at end of month x Average monthly revenue per customer
Cumulative revenue
Cumulative revenue = The sum of the monthly revenue for every month in the projection period
Projected ARR
Projected ARR = Customers at end of the projection period x Average monthly revenue per customer x 12
Starting ARR
Starting ARR = Current paying customers x Average monthly revenue per customer x 12
ARR impact of the churn change
ARR impact = Projected ARR at target churn – Projected ARR at current churn
Cumulative revenue impact
Cumulative revenue impact = Cumulative revenue at target churn – Cumulative revenue at current churn
ARR change versus current churn
ARR change percentage = ARR impact / Projected ARR at current churn x 100
Equivalent annual churn
Equivalent annual churn = (1 – (1 – Monthly churn rate) raised to the power of 12) x 100
This shows what a monthly churn rate means across a full year. A 5% monthly churn rate, for example, is roughly 46% annual churn, not 60%, because customers who leave stop being counted in later months.
Starting customers still active
Starting customers still active = (1 – Monthly churn rate) raised to the power of the number of months x 100
This shows how many of the customers you have today are still with you at the end of the projection period.
Average customer lifetime
Average customer lifetime in months = 1 / Monthly churn rate
If the churn rate is 0%, the lifetime cannot be calculated and the calculator shows a dash.
Example
Imagine a SaaS company with 1,000 customers, $100 average monthly revenue per customer and 20 new customers per month, over a 12-month projection.
With 5% monthly churn, the company ends the year with roughly 724 customers and about $869,000 in ARR. With 3% monthly churn, it ends with roughly 898 customers and about $1,078,000 in ARR. Reducing monthly churn by two percentage points adds around $208,000 in ARR, an increase of about 24%, without any change to acquisition.
Assumptions and Limitations
This calculator gives a simplified estimate, not a forecast. It assumes:
- A constant monthly churn rate and a constant number of new customers each month
- Flat pricing, with no upgrades, downgrades, discounts or price changes
- No expansion or contraction revenue
- Monthly revenue calculated on customers at the end of each month
Real churn varies by customer segment, plan, contract length and customer age, so use the results as a planning tool and compare them with your own data.
Why Reducing Churn Matters for SaaS Growth
Retention compounds. Every customer you keep continues to pay month after month, while every cancellation has to be replaced by new acquisition spend just to stay level. Lower churn also lengthens customer lifetime, which raises customer lifetime value and makes your acquisition cost easier to recover.
Common ways to reduce churn include improving onboarding, building customer success programs, offering annual plans, monitoring product usage to spot at-risk accounts, collecting cancellation feedback and fixing failed payments with automated retries.

Gabi is the founder and CEO of Adurbs Networks, a digital marketing company he started in 2016 after years of building web projects.
Beginning as a web designer, he quickly expanded into full-spectrum digital marketing, working on email marketing, SEO, social media, PPC, and affiliate marketing.
Known for a practical, no-fluff approach, Gabi is an expert in PPC Advertising and Amazon Sponsored Ads, helping brands refine campaigns, boost ROI, and stay competitive. He’s also managed affiliate programs from both sides, giving him deep insight into performance marketing.